mozgi
GPT Image 2.0
資訊圖表, 設計, 概念藝術, 3D, 介面
提示詞
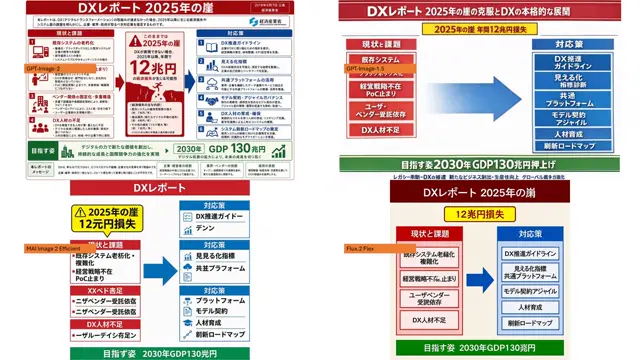
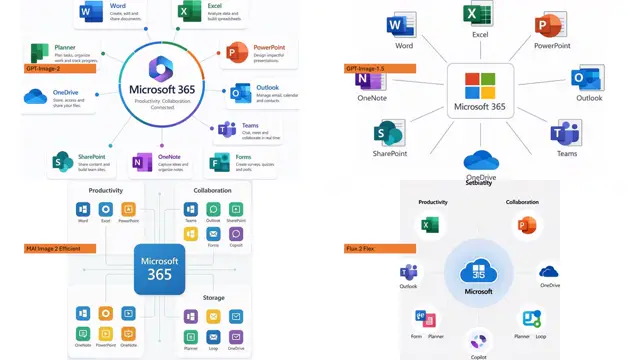
Using the provided reference image as a rough inspiration for an official explanatory slide/infographic, create a clean comparison image showing the same Microsoft 365 ecosystem concept generated in four different model styles.

Canvas and layout: 16:9 white slide, divided into exactly 4 quadrants in a 2×2 grid with generous whitespace and no hard divider lines.

Subject: Each quadrant should show a Microsoft 365 hub-and-spoke or app ecosystem diagram centered on Microsoft 365, with surrounding Microsoft app icons and short English labels.

Quadrants and visible orange model tags: Include exactly 4 orange labels, one per quadrant:
1. Top-left: GPT-Image-2 — polished circular Microsoft 365 hub diagram with multiple app cards around it.
2. Top-right: GPT-Image-1.5 — simpler radial hub diagram with icons around a central Microsoft 365 box.
3. Bottom-left: MAI Image 2 Efficient — structured dashboard-like diagram with grouped sections such as Productivity, Collaboration, and Storage.
4. Bottom-right: Flux.2 Flex — soft circular diagram with icons orbiting a central Microsoft cloud-style mark.

Apps to include across the diagrams: Word, Excel, PowerPoint, Outlook, Teams, OneDrive, SharePoint, OneNote, Planner, Forms, Loop, and Copilot where appropriate. Use recognizable Microsoft-style colored app icons, but keep everything as a generated infographic rather than a screenshot.

Style: Modern corporate PowerPoint infographic style, crisp readable English text, flat vector icons, subtle shadows, light gray connector lines, mostly white background, Microsoft blue/green/orange/purple palette. Keep the overall image clean and presentation-ready.
- 需要你自己的照片:在請求中附上圖片,提示詞會以它為基礎。
此提示詞的權利屬於作者 @hrfmjp。任何商業使用(推廣 AI 工具、聚合平台、Telegram 機器人)由你自行負責,mozgi.io 不承擔任何責任。 詳情 →