mozgi
Seedream 4.5 / 5.0
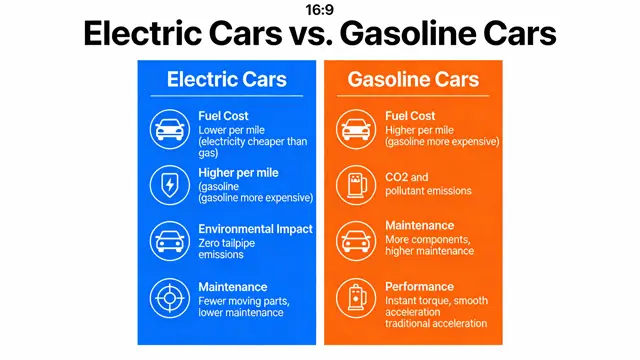
An infographic compares electric and gasoline cars by fuel costs, emissions, maintenance, and performance
Prompt
A visual comparison chart (a “vs.” infographic) comparing electric cars and gasoline cars. The chart should have two columns, with icons and brief text comparing them on factors like Fuel Cost, Environmental Impact, Maintenance, and Performance. The design should be clean, modern, and easy to understand at a glance, demonstrating the ability to visually organize and present comparative data. –ar 16:9
The rights to this prompt belong to its author @jaredliu_bravo. You are responsible for any commercial use — promoting AI tools, aggregators or Telegram bots: mozgi.io accepts no liability. Details →